


Several month ago I wrote about "solving 600 problems in 1 year" (https://leetcode.com/discuss/general-discussion/571805/600-problems-in-one-year). From that post, some of the people asked the tools that I have used for tracking my progress while solving all that problems. However, in that time I used simple "Google Sheets" for everything. After that post, I thought: "if other people are also interested on tracking their results, why not to create such kind of tool?". Then, I have created preplogger.com (http://preplogger.com/). The idea of preplogger to track the progress while preparing to the interview processes.
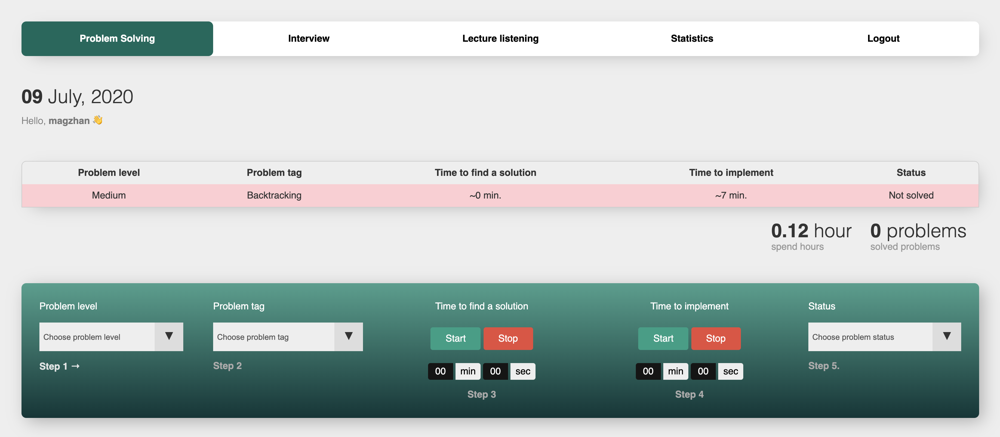
Problem solving section.
In the main page you can see the following sections:
- All your problems that you have tried to solve for today. The problems that you was not be able to solve colored with red. The problems that you solved colored with light green and the problems that you solved with hinths colored with dark green. At the end there is a time that you spend for preparation and number of problems that you have solved for today.
- The second section is tool bar for tracking the preparation process. You can select problem level (easy, medium or hard), problem tag. Then once you open the problem you can start first timer. First timer is responsible for thinking, finding a solution. Once you know how to solve the problem you can stop the timer and start the second timer and start coding. The second timer is responsible for tracking the implementation time. Once you submit and got "accepted" you can stop the timer and choose the status (solved, not solved or solved with hints).
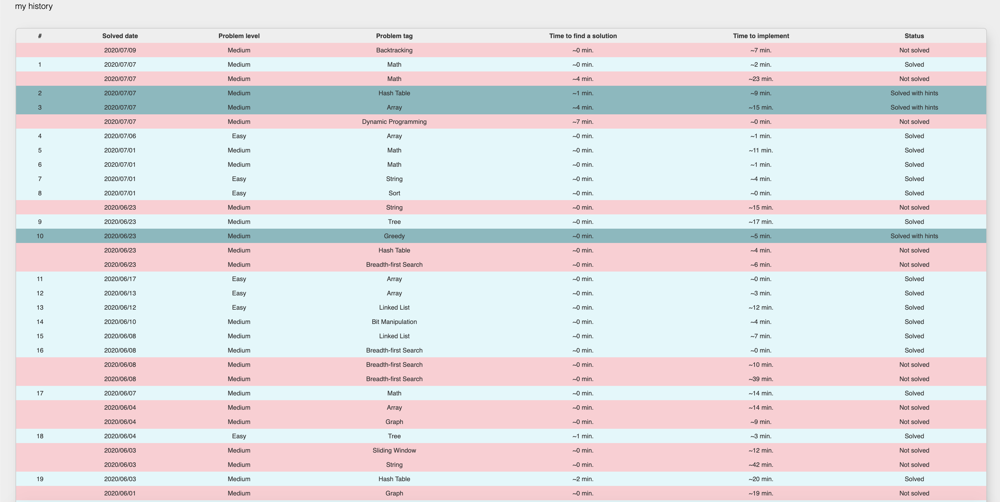
- At the end of the page you can see the history of submissions. The system counts the problems that are "solved" or "solved with hints". If the time for thinking or implementation is less than minute, it writes "0 min". Therefore, in my history for most of the problems the "time to find a solution" is ~0 min.
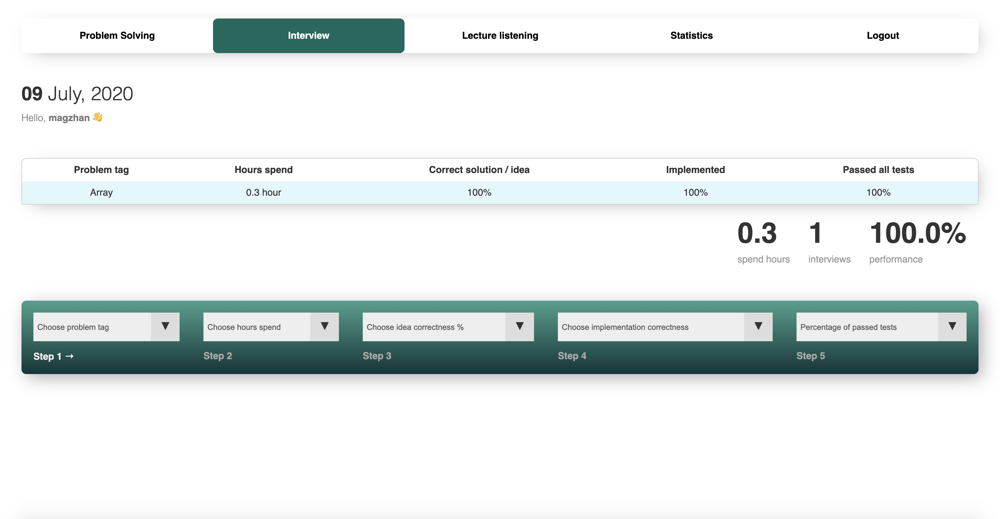
Mock Interview Section
This section is for tracking your mock interview results. After doing the mock interview, I select the problem tag, time to spend for mock interview, solution correctness percentage, implemenation correctness percentage and passed test cases. You can also see all your mock interviews. After building this service I had only one mock interview and the purpose of that mock interview was to test the system :) You can see the total time to spend for mock interview and total number of interviews and overall performance in all your intervews.
Tutorial Section
Whenever you watch online lectures, tutorials or read books you can use this section in order to track the time that you spend for preparation. You can see the total number of hours that you spend for reading and watching online tutorials.
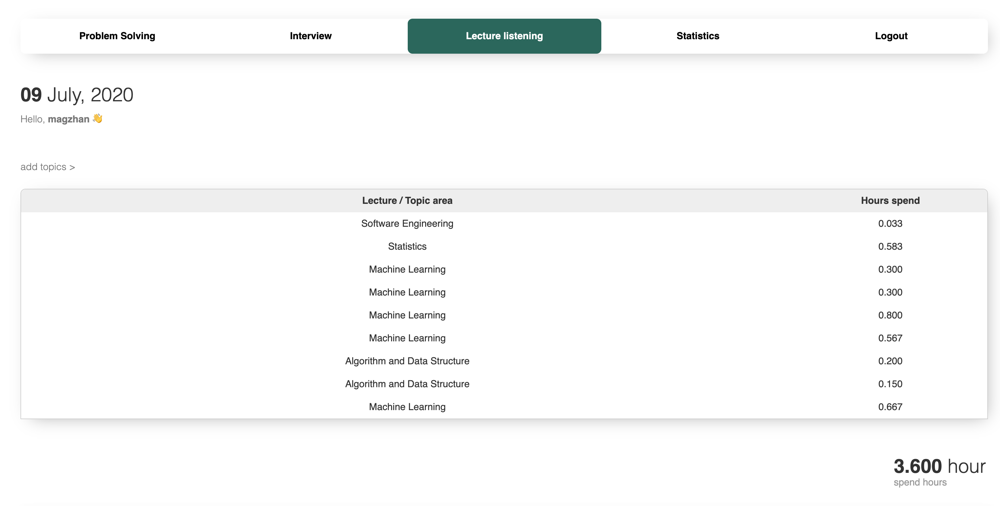
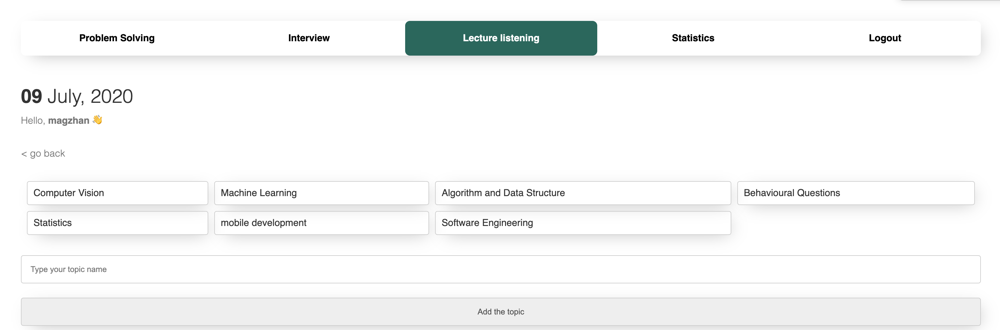
You can add your own topics that you are most interested and whenever you spend the time for them you can just choose it from drop down menu.

Whenever you start preparation you just have to start timer and whenever you stop preparation you have to stop timer.
Statistics section
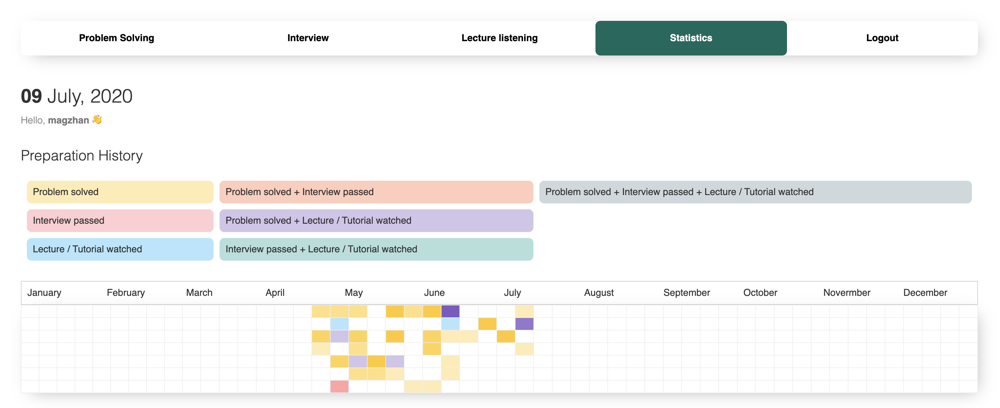
In this section you can see your own statistics. First subsection shows your daily activities. There is a definition for each color on top of the table.
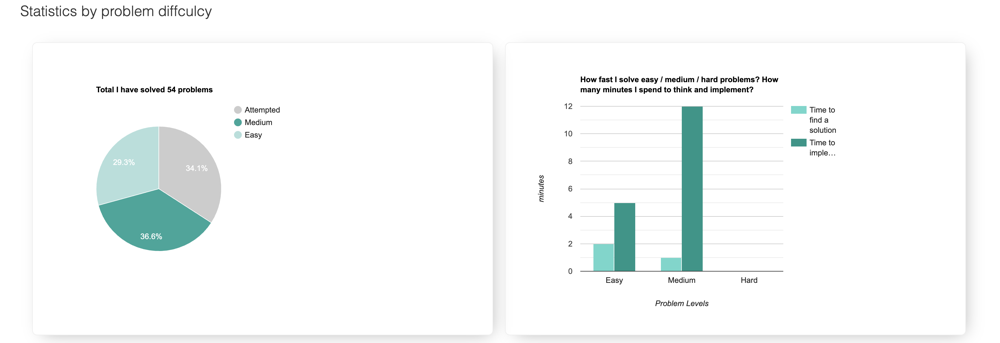
You can see the statistics by problem difficulcy. It shows number of problems for each level (easy, medium, hard). Also, it shows "how many minutes you spend for thinking" and "how many minutes you spend for implemenation" for different levels of problems.
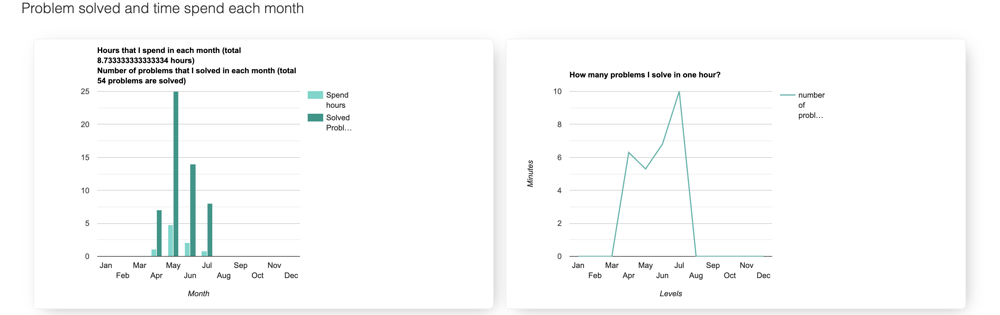
The following charts show the number of problems you solved for each month and number of problems that you solved in one hour for each month.
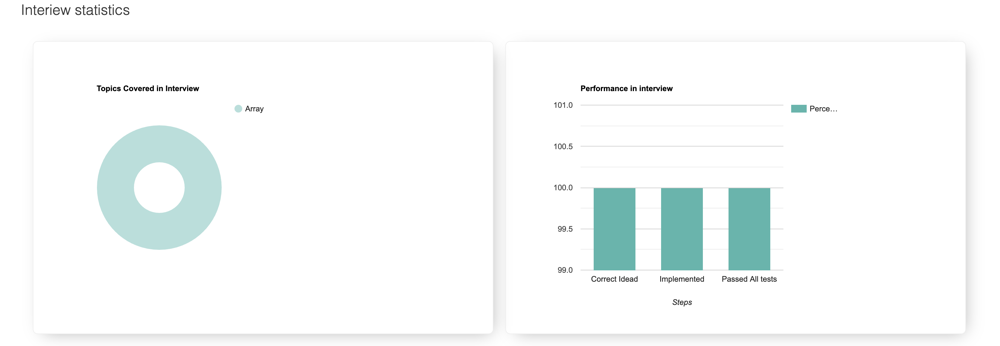
Interview statistics shows the topics that you have during the interview and your overall performance. I had only one mock interview and the problem was realted to arrays.
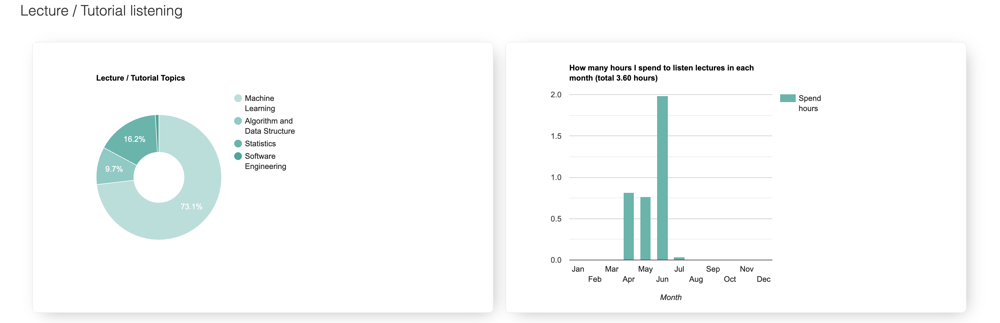
Last chart is about lecture / tutorial watching / reading process. You can see the time that you spend for each topic and total amount of time that you spend each month.
I have to mention that I am "Machine Learning engineer". Therefore, I have less amount of experience in web development. Therefore, there are bugs and UI / UX problems in the service. If someone is interested, I can share the code to github, make it open for everyone and maybe we can create open source tool :)
Thanks for reading untill the end :)