
Dear LeetCoders,
We are excited to announce a brand new debugger that allows you to debug your program right inside the LeetCode code editor. We believe this built-in debugger will enhance your code learning experience, enabling you to code and debug anywhere 24/7, as long as you have an internet connection and a browser. 😄
Please note that the debugger is not a replacement of the usual print-to-stdout debugging method, but rather a nice alternative where printing to stdout would not make it or may take too much time. Just like any tool, with the proper (and responsible 😉) use we believe the debugger will help you improve your coding skills more quickly and land your dream job. 🚀
The debugger currently supports six languages:
- C++
- Java
- Python/Python3
- C
- C#
- Javascript
- Typescript
- Kotlin
- Go
Using the debugger is as easy as 1⃣️2⃣️3⃣️, start debugging 💻now by following the steps below:
1. Make sure you've selected one of the supported language
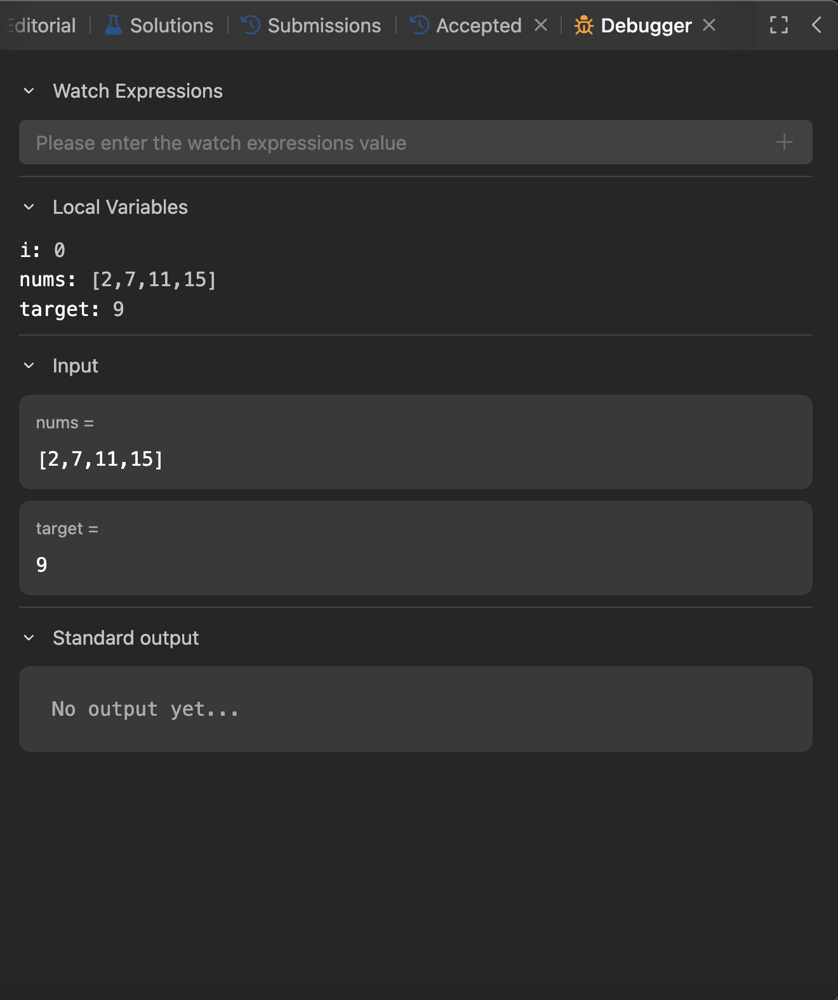
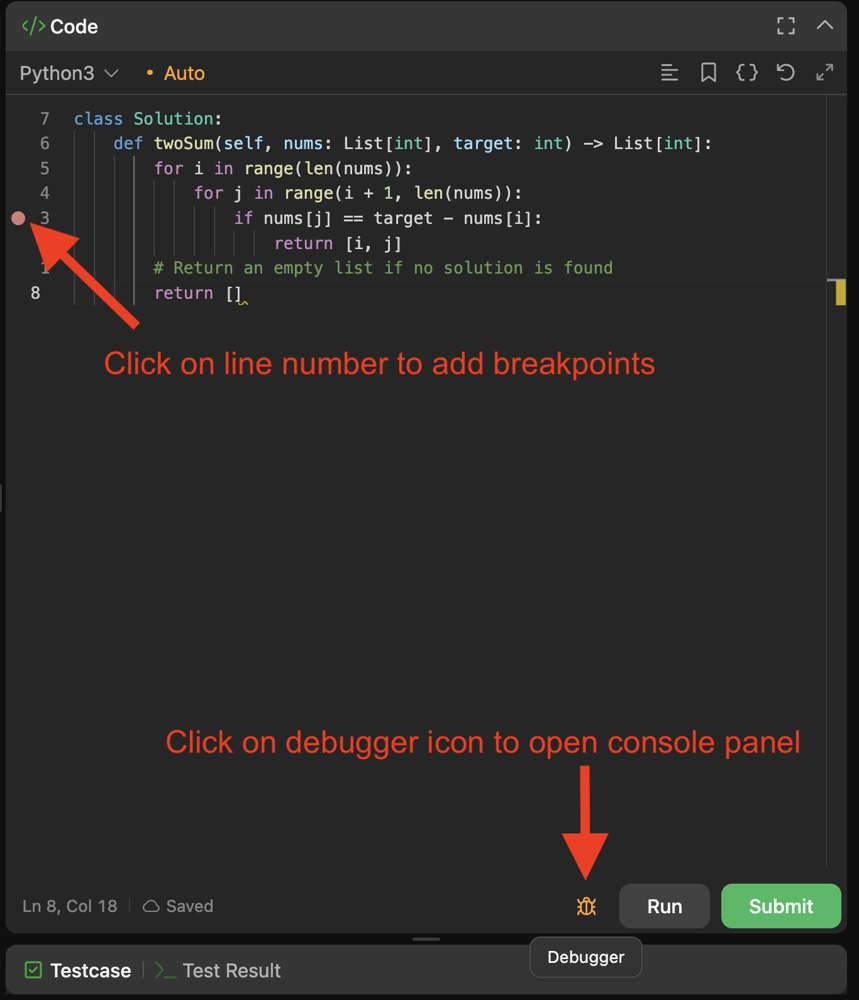
2. Click on line number to add breakpoints and click on debugger icon to open the console panel
3. Use debug operations control buttons to step through code